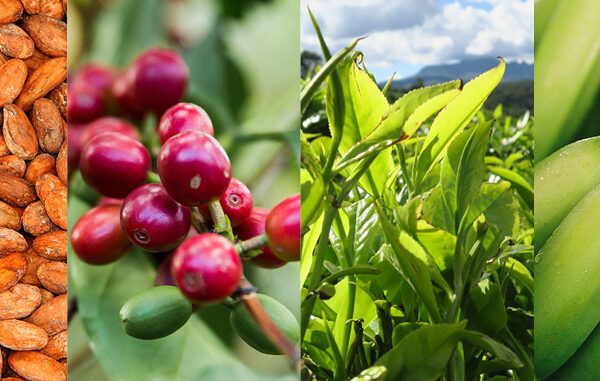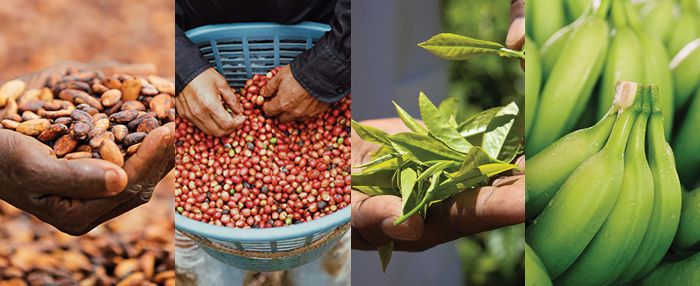
We’re happy to share the 2020 certification data reports for the Rainforest Alliance and UTZ coffee, cocoa, tea, and banana programs. Please see our summaries below and download each sector’s annual data report for more facts and figures and data visualizations.
Coffee
In 2020, both the Rainforest Alliance and the UTZ certification programs continued with the growth trend we saw in the previous year, regarding most of the relevant indicators. Estimated certified production volume, the number of farmers, certified production area, and global producer sales all reported increases in both certification programs.
Regarding certified estimated production volume, the UTZ program grew by 14 percent and the Rainforest Alliance program grew by 15 percent.
As for the sales of certified products, the UTZ program reported a growth of 20 percent, compared to two percent in the Rainforest Alliance program. This resulted in a supply and demand ratio of 57 percent for UTZ and 52 percent for the Rainforest Alliance program.
Since 2017, the Rainforest Alliance program has increased 44 percent and the UTZ program has increased by 94 percent.
Putting these numbers in a more historical context, we can conclude that the UTZ certification program has increased 94 percent in sales since 2017, whereas the Rainforest Alliance program has increased 44 percent since 2017.
Download the coffee data report
Cocoa
In 2020, we saw the impact of several of our supply interventions. We launched phase 2 of the Cocoa Assurance Plan, a set of measures to strengthen certification in the cocoa sector.
Phase 2 of our Cocoa Assurance Plan led to a higher overall supply and demand ratio.
During this phase, we:
- extended the pause on new growth in Côte d’Ivoire and Ghana and expanded it to include Cameroon and Nigeria. No new producer groups and individual farms were allowed to join the program in 2019-2020;
- introduced a ban on dual certification of UTZ and Rainforest Alliance in Côte d’Ivoire and Ghana;
- introduced an audit allocation system in Côte d’Ivoire and Ghana. Through this system we saw further significant improvements in assurance and impact on available supply;
- provided deforestation and encroachment risk assessments to all certified groups.
These factors led to a better alignment between certified production and demand, and a higher overall supply and demand ratio. For the first time ever, we are also publishing premium data for Rainforest Alliance cocoa from Côte d’Ivoire and Ghana. All of these interventions together will help us prepare our current programs for the transition to our 2020 Rainforest Alliance Certification Program.
While estimated certified production and sales from Africa decreased slightly, we saw increases in both producer sales and estimated production in Latin America and Asia Pacific. Global demand for certified cocoa decreased slightly compared to 2019.
Download the cocoa data report
Tea
In 2020, the Rainforest Alliance tea program grew across most of our indicators. We saw an increase in estimated production volume (up 12 percent), certified production area (up five percent), and number of certified farmers (up two percent). The number of workers remained stable. The sales of Rainforest Alliance Certified tea went up slightly (by two percent). Therefore, in 2020, 27 percent of tea produced as certified was sold as certified.
Even in troubling times, the health benefits and positive wellbeing associated with tea position it well in the market.
The UTZ tea program saw further shrinkage in 2020. The estimated production volume decreased (down 18 percent), as well as the area certified (down 10 percent). While the number of workers went down (by 30 percent), we saw a growth in the number of certified farmers (up 14 percent). Disappointingly, sales of UTZ certified tea dropped (down 26 percent). This means that in 2020, just 6 percent of tea produced as certified was bought as certified.
Looking at the context of the tea sector as a whole, there is no doubt that tea businesses had to operate under very different circumstances and constraints since COVID-19 struck in early 2020. Imports into developed tea markets fell and didn’t start to recover until late 2020. In consumer markets, we saw an ever more marked divide, with retail brands and retail channel product sales booming while food service/out-of-home sales have struggled due to restrictions on public gathering.
Additionally, the premium (or specialty) tea sector has fared quite well. Consumers in developed tea markets were willing to spend a bit more for products with a quality promise. Tea’s obvious health benefits, as well as its reputation for promoting wellbeing, position it well even in troubled times.
Banana
Despite a variety of challenges, the banana program continued to see an increase in estimated certified volume.
In 2020, the banana sector had to deal with the shocks of COVID-19, the spread of TR4 disease to Latin America, and several severe climate disasters in Guatemala and Honduras.
Despite those challenges, the Rainforest Alliance banana program continued to see an increase in the estimated certified volume, getting close to 9.5 million MT produced by a steady number of over 2,000 farms on nearly 190,000 hectares.
Sales figures for 2020 are forthcoming in July 2021. We expect these figures to be in line with the 2.2 million MT sold in 2019.
Download the banana data report