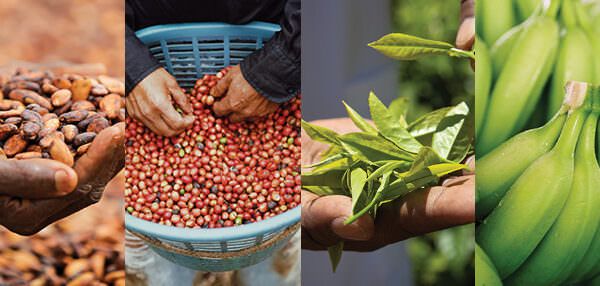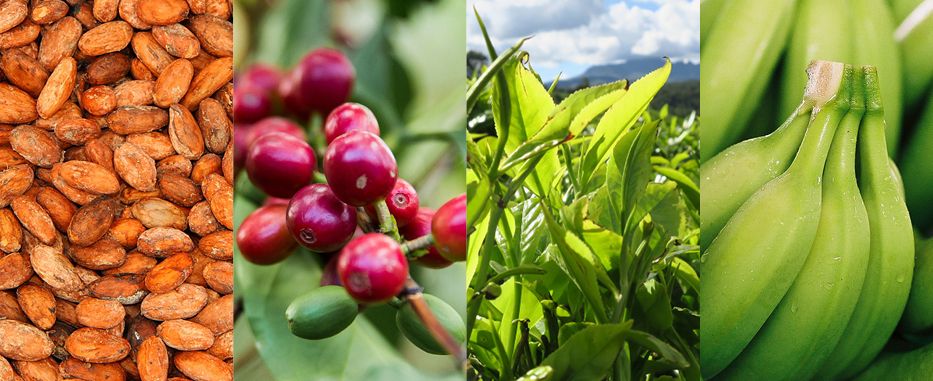
We’re happy to share the 2021 certification data reports for the Rainforest Alliance and UTZ coffee, cocoa, tea, and banana programs. Below, you’ll find short summaries of the main takeaways plus links to download each sector’s annual data report where you’ll find more facts, figures, and data visualizations.
Following the 2018 merger of the Rainforest Alliance and UTZ, in 2021 we began the transition from two previous certification systems—the UTZ program and the 2017 Rainforest Alliance program—to our 2020 Rainforest Alliance Certification Program. These reports therefore present 2021 figures from one or more programs as is relevant for each sector and its transition timeline.
- Figures reported for cocoa, coffee and tea pertain to the UTZ and 2017 Rainforest Alliance programs.
- Figures for bananas in 2021 pertain to the 2017 Rainforest Alliance program.
- All reports consider: (i) farm certificate holders with an active license/certificate, valid as of 31 December 2021; and (ii) farm certificate holders whose licenses expired in 2021 but have officially registered for the 2020 Rainforest Alliance Certification Program. When necessary, we confirmed re-certification or registration status with Certification Bodies.
- The data used for our calculations comes from our traceability platforms: MultiTrace and Good Inside Portal (GIP) for UTZ, and Marketplace and Salesforce for the 2017 Rainforest Alliance program.
- Figures are reported separately for the UTZ and 2017 Rainforest Alliance programs, but combined figures are available for the number of producing countries, the number of farmers, and the size of certified area.
Cocoa
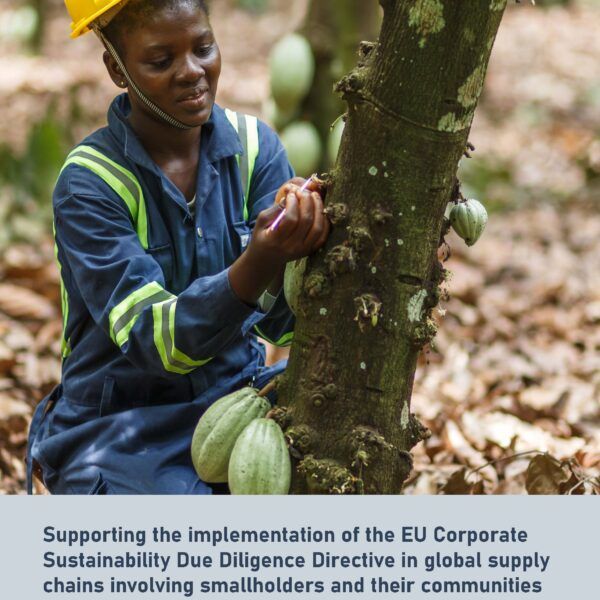
All told, 2021 saw steady market demand for certified cocoa globally. In Africa, we continued to see the effects of our Cocoa Assurance Plan—an ambitious set of measures to strengthen the Rainforest Alliance’s cocoa program across Côte d’Ivoire, Ghana, Nigeria, and Cameroon. These measures—which include stricter requirements on GPS location data and prohibiting dual UTZ/Rainforest Alliance farm certification—contributed to a drop in certified cocoa volumes produced in the region. Nevertheless, we continued to see steady demand across Africa, which led to better alignment between certified production and sales, and a higher overall supply/demand ratio.
In Latin America, we saw a small decline in certified production, while demand increased. Meanwhile, in Asia, certified production increased, while demand decreased.
Some of these regional shifts in certified production and demand are likely due, in part, to the introduction of Origin Matching Mass Balance, along with the continuing effects of the COVID 19 pandemic. Additionally, we expect that the transition to the 2020 Rainforest Alliance Certification Program has had some bearing on these volumes and we will see the results of this transition in our 2022 data.
Download the cocoa data report
Coffee
In 2021, the combined UTZ-Rainforest Alliance coffee program continued the overall growth trend recorded in the previous year. Within that, estimated certified production volumes for the 2017 Rainforest Alliance program grew by ten percent, while the UTZ program remained stable. Both programs also saw an increase in the number of farmers and the total area planted with certified coffee. However, the Rainforest Alliance program reported an increase in the number of certificate holders, while the UTZ program reported a decrease.
For market uptake, global producer sales for the UTZ certification program experienced a 7% decline, while the same indicator in the Rainforest Alliance (2017) certification program grew by 9%.This means that the programs’ reach yielded modest growth, while market uptake of the two programs taken together declined by one percent overall compared to 2020.
Download the cofee data report
Tea
In 2021, the Rainforest Alliance tea program grew across most of our indicators. Despite significant challenges across the tea sector at large (from rising input costs for farmers and shipping costs for exporters, to falling out-of-home tea consumption), we saw the total area planted with certified tea grow to nearly 700,000 hectares worldwide. Similarly, we noted an increase in the number of farmers in the tea program, which now totals more than one million.
In contrast, the number of workers in the Rainforest Alliance tea program declined by more than ten percent to 712,000 workers. There are several driving factors (including changes in certification status for some members during 2021), but we attribute much of this shift to the challenges in hiring workers due to travel restrictions and other risks related to COVID 19.
As expected, the UTZ tea program continued to shrink in 2021—a result of the transition to the 2020 Rainforest Alliance Certification Program. Within that, we note that although production volumes rose in aggregate, there were notable decreases in production in Malawi, Indonesia, and Turkey.
Banana
In 2021, the Rainforest Alliance banana program continued to grow across multiple indicators. Despite the many serious challenges facing the banana sector—from the continued fallout from the COVID-19 pandemic to rising costs—we saw certified production volumes increase to nearly 9.5 million MT. The number of farms also increased to more than 2,500 farms, covering close to 250,000 hectares.
Similarly, we have seen a three percent increase in the number of supply chain actors in our program. Global sales figures for 2021 are forthcoming in July 2022.
Download the banana data report